Choose the data layers you want to see on the map to gain valuable insights
Agcor provides a wide range of data layers that enable users to visualize multiple types of data at the same time, offering valuable insights.
- From the home screen, click on the “Research Tool” tile

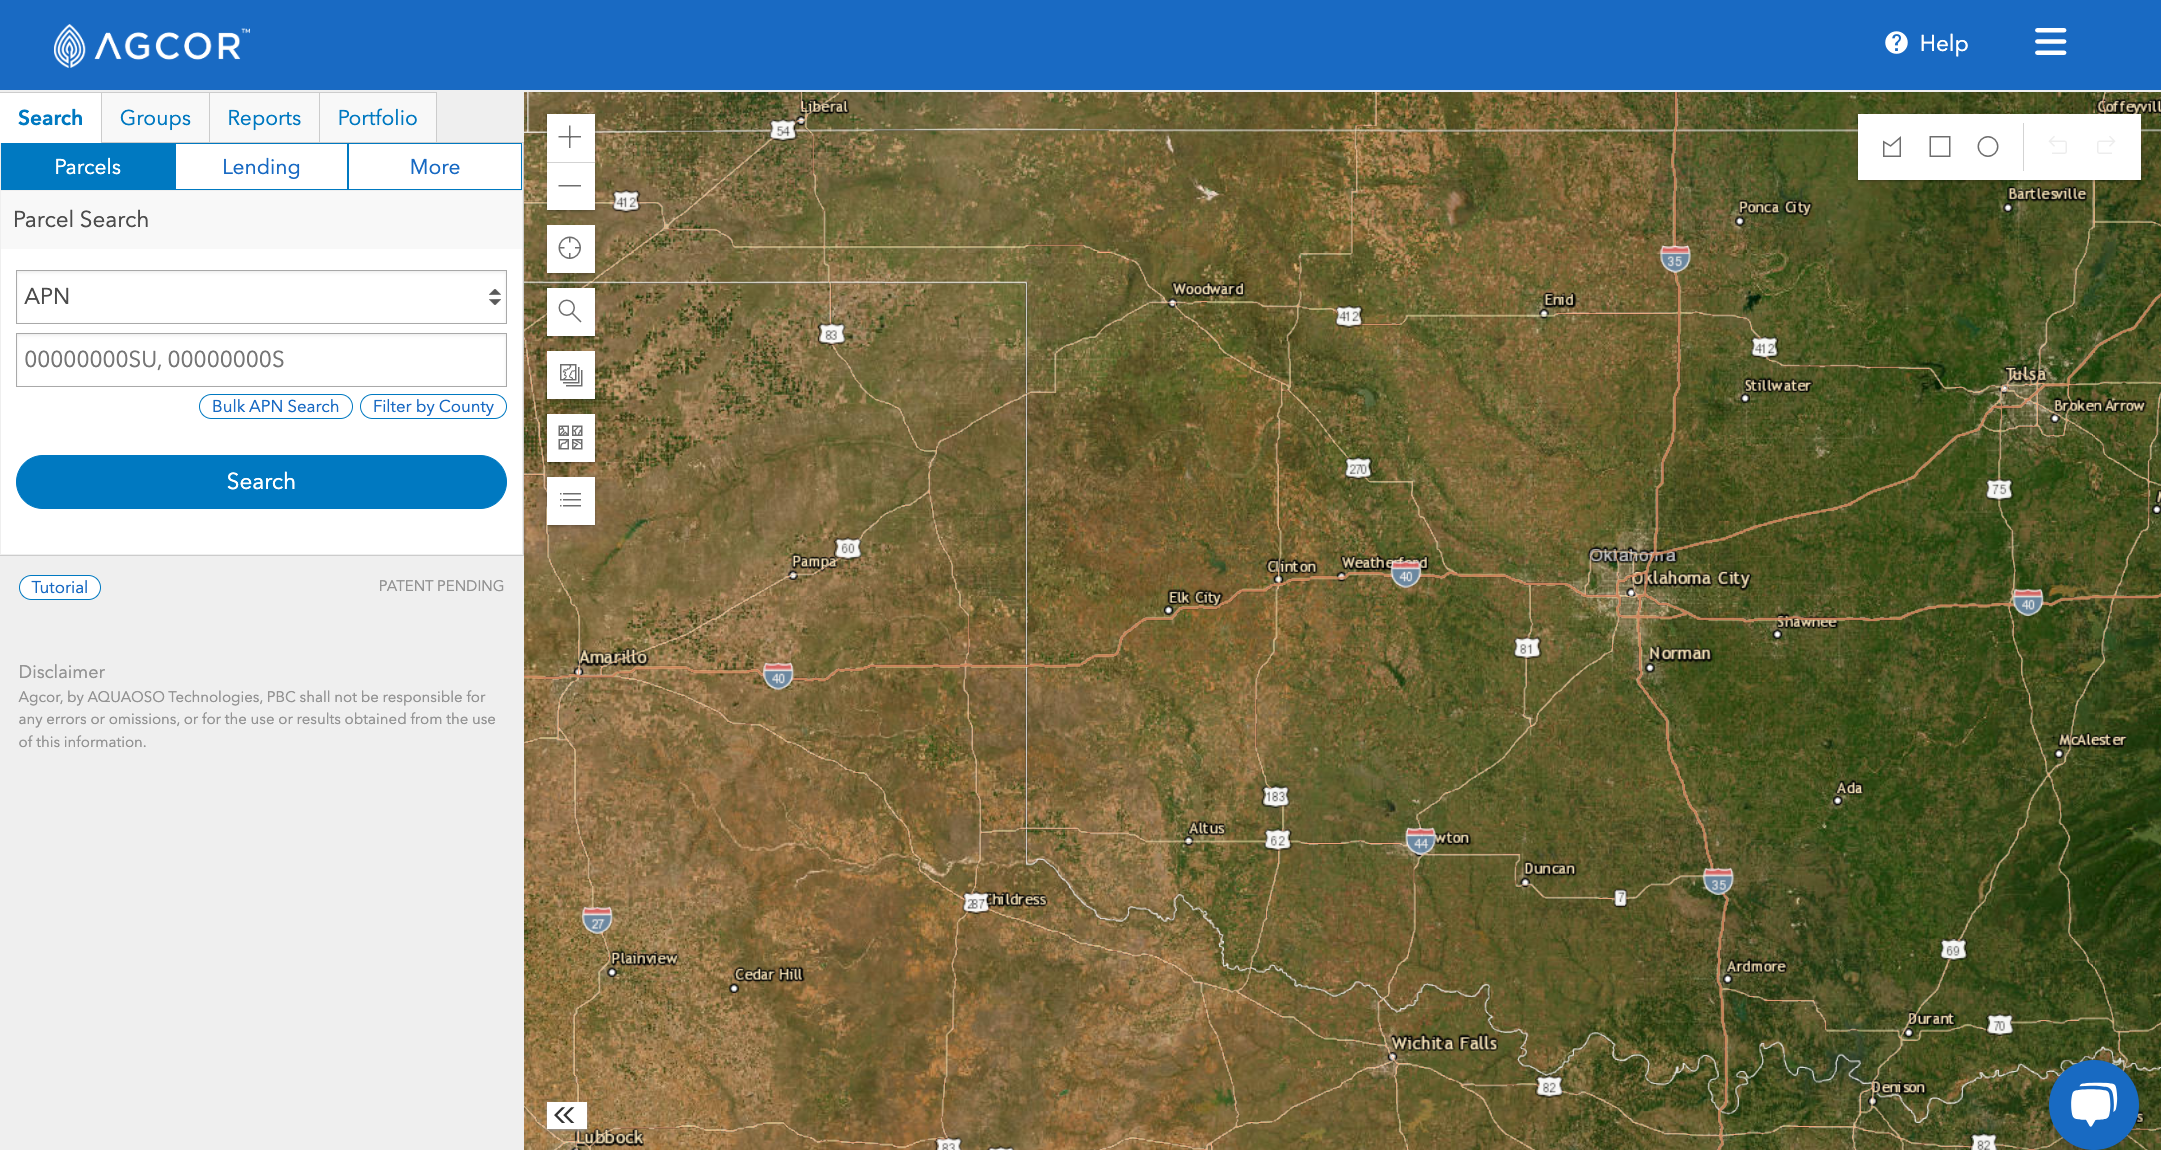
- The Research Tool and Map will open

- There are 7 buttons in the upper-left corner of the map that allow you to control the map:
 Zoom In
 Zoom Out
 Find My Location
 Search by Address
 Map Layers – control the display of data boundaries shown on the map
 Change Basemap – controls the underlying image of terrain
 Legend - defines the meanings of the colors/symbols in the Map Layers
- Click the Map Layers button to see a list of all available layers to view on the map. Select the eye button beside of a layer to turn it on
 and off
  .
.
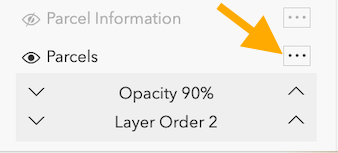
NOTE: Some layers are only displayed at certain zoom levels and therefore you may need to adjust your zoom level (in or out) to view. - Opacity and Layer Order can be adjusted by clicking on the button with 3 small dots next to each Map Layer

- Refer to the Agcor Data FAQ for a description of the data layers
Tip: Data layers use certain colors and patterns that might be more easily viewed when placed upon different basemaps.
