Generate a dashboard of filtered risk exposure views that integrates your organization's lending data with parcel and climate data
How to Generate a Dashboard
To visualize the Lending data for your Organization (either in total, or filtered down to risk exposures of interest), you can generate a Dashboard and subsequently run a Portfolio Report.

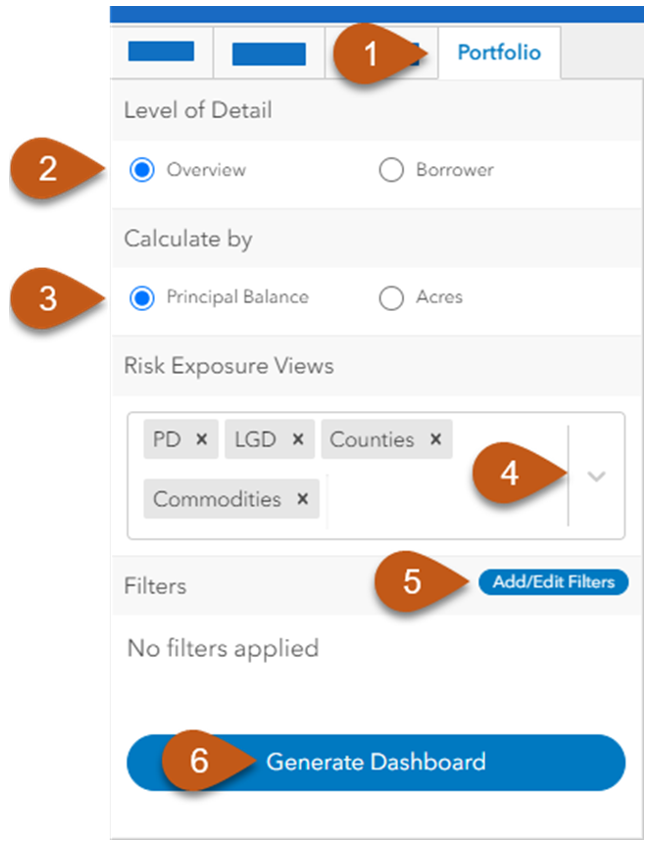
1) Click on the Portfolio tab in the upper left sidebar.
2) Select a Level of Detail for the Dashboard charts: Overview or Borrower
- "Overview" will display bar charts categorizing data within your Portfolio

- "Borrower" will display a table with columns for Borrower Name, Loan Number, Principal Balance, Debt per Acre, Total Acres, and any selected "Risk Exposure Views"

3) If the Level of Detail selected is “Overview”, there is an option to Calculate the risk exposure charts by either Principal Balance or Acres. (The “Borrower” level of detail will always contain both.)
4) Select “Risk Exposure Views” to determine which charts or columns will be displayed.
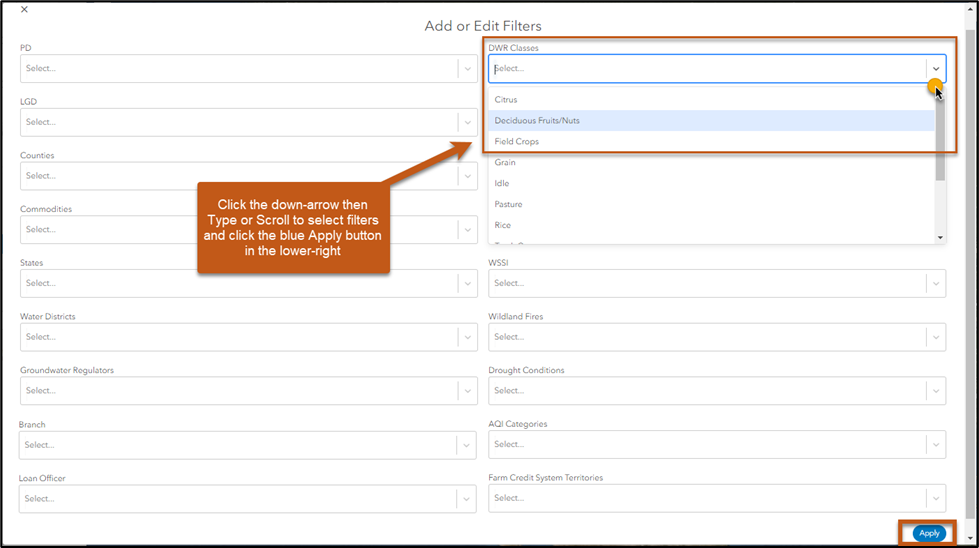
5) Optionally click the “Add/Edit Filters” button to drill-down to show only the portions of your portfolio associated with a particular risk profile. A popup will appear that allows you to select the data of interest.

- Selecting multiple options from within the same Filter drop-down displays ANY results with that criteria.
- Selecting multiple Filters simultaneously will display only the results that meet the criteria of BOTH sets of Filters.

6) Click the Generate Dashboard button and the Portfolio Dashboard will appear
